Selected Topics in Geoinformatics
Instructors: Josef Strobl, Ainura Nazarkulova
This course involved different professors, researchers, and professionals elaborating on a variety of topics regarding geoinformatics.
SliDEM: An open-source based workflow for DEM generation from Sentinel-1 for landslide volume estimation
Lorena Abad
The focus of the presentation was about the project “SliDEM”, which takes place at the University of Salzburg, and it aims at assessing the suitability of Digital Elevation Models (DEMs) derived from Sentinel-1 to estimate the landslide volume. EO data provide a quick overview of a study area and cover large portions of land, without having to visit the area. Additionally, measurements are taken in a systematic way, with known and relatively short revisit time intervals. When using DEMs for analysis, there are some limitations, since DEMs represent areas in specific points in time, for example before or after a landslide, but not at the time they occurred. To overcome this issue, the objective of the project is to generate DEMs from Sentinel-1 images through an automated and transferable workflow. The automated way that was created can eliminate the time spent for acquiring for example the right data, which can normally take days and ultimately the processing time, thus allowing to focus more on the results, their quality and their value. Additionally using an automated workflow, human errors can be minimized. I personally found “Dockerisation”, which allows for the integration of different tools and workflows, also really useful since you are able to transfer the workflow among different devices with different operation systems and software versions. To assess the quality of the DEMs produced, reference DEMs were utilized. The errors in the DEMs that were produced were eliminated by corregistering them to the reference DEMs. Another advantage of using an automated workflow is that it enables the creation of many DEMs and with having more data available, the correction of errors is possible. Some of these artifacts may derive from high vegetation coverage, steep topography, weather conditions, materials that were disposed etc. According to the speaker, there is still room for improvement, but the automation of the workflow is certainly beneficial since it shifts the main focus from creating the DEMs to now evaluating them and eliminate errors.

Participative Urban Planning
Irina Paraschivoiu
The speaker introduced the concept of “Participative Urban Planning”, where more control is given to the citizens regarding different aspects of the place that they live in. It is realized that planning a city can’t be done from the comfort of an office, but rather planners need to observe and interact with people, record places where they gather and understand their needs. The process of urban planning is necessary because our lives not only depend on political decisions that are made, but also on practical things like transportation. The need of citizen participation relies on the fact that cities are unique and what was implemented somewhere might not work somewhere else, so different ideas need to be discussed and evaluated. Thus, dialogue and engagement are necessary. It is interesting that cities are not always perceived by people through real maps but rather through “mental maps” and associations people make regarding the urban environment. Through mental maps things that can’t be really seen can be mapped, like demographics or even people’s perception of a place. To figure out what people think of a place, for example transportation or other problems that might take place in space, they can be associated with maps. What I personally found interesting was the concept of “biomapping” which refers to tracking the physical response of people throughout the city, find stressful or more relaxed routes etc. I believe this could be a great way to assess where for example new cycling routes can be build, by a evaluating peoples response while cycling in different parts of the, which could be impacted by traffic, badly maintained roads and other factors. Since many people struggle with usual 2D maps, another way to implement citizen participation would be through 3D models, which allow people to understand space better and induce a more natural way of interaction. Other modern technologies can be utilized as well, like augmented reality, virtual reality, gamification and more. Lastly, something that came to my mind while attending the presentation, was that volunteer mapping and the organization of mapathons could also be a form of citizen participation. The question is, what would an urban planner do with all the data that is produced and how could that assist in planning urban space?

Introduction to Satellite Based Atmospheric and Climatic Observations
Dr. Shahnawaz
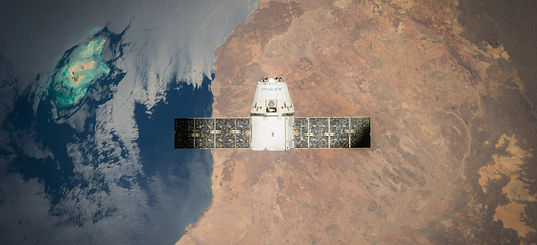
This session gave an overview of how satellite data can be utilized to study the Earth’s atmosphere and make observations regarding the Earth’s climate. First, some introductory topics were introduced like climate change, which is unfortunately mainly caused by greenhouse gases produced by human activities. Climate change is currently an important issue and satellite data can assist us in studying it and potentially deal with it. Having available large amounts of data from both passive and active sensors that go back in time for several decades, allows us to perform time series analysis and study changes in the Earth’s climate. Some examples of satellite missions that provide us with such data are: the “AQUA” mission from NASA launched in 2002, which carries instruments that allow us to measure greenhouse gases in our atmosphere, the temperature, and more, and the “TERRA” mission launched in 1999, which carries sensors that enable us to make measurements about clouds and aerosols. What I found interesting is that there are also open data provided on an everyday basis from the Global Precipitation Measurement (GPM) mission that enables us to study the Earth’s atmosphere. Another advantage of satellite observations is that they cover (almost) the whole surface of the Earth without having gaps in the data like it is happening with measurements from meteorological stations that are not equally distributed across our planet. That is for example a problem when trying to study phenomena that are affected or caused by our oceans (e.g because of evaporation), since there are not enough meteorological stations there, but with satellite observations, we can overcome this problem. All in all, satellite data are an integral part of atmospheric studies, especially in the era of climate change.

GeoSpatial Applications of Satellite Generated Atmospheric and Climatic Observations - Case Studies from India
Dr. Shahnawaz
In this session, case studies from India were presented around the topic of atmospheric and climatic observations derived from satellites. As previously mentioned, satellites provide continuous measurements of our Earth’s surface, allowing the study of air pollution, aerosols, air temperature and precipitation. The presentation provided insights and recommendations about satellite data sets that can be utilized in order to study the abovementioned parameters. A piece of information that I found enlightening was that aerosols have not been necessarily produced over the area that is found/observed, but they can be transferred with the air, which might make it difficult to define their source. Another useful insight from the talk was that if we want to map the rising temperature as an indicator of climate change, this can be done by mapping the temperature standard deviation derived from satellite observations. Lastly, when studying climate phenomena, we should keep in mind that they are influenced by the topography of an area, by ocean circulation and by geography in general.
Illustrating cities through maps
Oana Candit
This session focused on the creation of city maps using different ArcGIS software and applications, while examples from the writer’s work were also presented. Throughout the presentation, many useful tips and tricks for map creation were provided, regarding the use of fonts, colors, symbols, map elements and more. It was illustrated that the application of different effects on map symbols should be done according to the aim of the map and the audience it will be addressed to. Additionally, the usage of layers among different ESRI platforms was useful to understand. What I found particularly interesting was the “Experience builder” tool which allows for the creation of 3D scenes, widgets, animation and more and could be a powerful tool with a lot of potential. Another thing that I found useful was the possibility to create styles for symbols, for example by creating gradient colors.

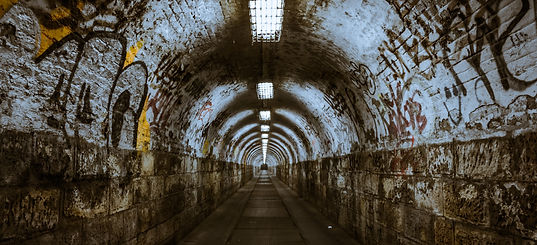
Graffiti as Spatial Information
Piotr Trzepacz
This session discussed how graffiti may indicate the ownership of “space”. I personally found this topic really unique and informative as had never heard or read about using graffities to “study” a city. Although graffiti has changed overtime, it often creates an ‘’image’’ of a city that is not managed well, indicating for example criminal activities, racism, political polarization etc. In this particular case study that was presented, graffities supporting football teams were “mapped’’ in order to identify areas that support those specific teams. Like geographic data layers, graffities may also create layers of information on walls, that indicate spots of territorial activities. The process of building a data base with all the geolocated data (graffities) that were collected during field mapping was also insightful, since it made me think of different attributes that geospatial data have in general and how can we determine which are useful and should be documented and which are not. Additionally, I found the doubt about how to properly visualize the data that were collected on a map relevant and also an important question to ask myself when doing similar tasks. Finally, the creation of “mental maps” trying to define where and why people feel more safe was an interesting part of the study, since it showed how people behave and interact in space according to graffiti supporting specific teams.
Living Atlas
Josef Strobl
This session introduced the capabilities of ArcGIS Living Atlas of the World (ESRI). Living Atlas provides large amounts of data, covering different countries or even the whole world. The data are provided in different formats, like features, maps or tiles, and they can be used and integrated for different types of analysis among ESRI desktop and web application, like ArcGIS Pro, StoryMaps, Scenes and much more or they can even be used for simple visualization tasks, like creating a map. The above makes Living Atlas a useful platform for academic projects. Additionally, I believe that an advantage of Living Atlas is that it is not required to download large data sets, like satellite images or Digital Elevation models, in your local computer, which solves the problem of not having enough storage for all those data as it usually occurs. I also find it impressive that Living Atlas hosts diverse data sets like Landsat or Sentinel imagery, data from OpenStreetMap and even dynamically created layers like Hillshade and Slope. Apart from layers, Living Atlas offers a variety of content types, one of which is ‘’apps’’. Since I personally work more with remote sensing data, particularly satellite images, I believe that the “Landsat Explorer app” as well as the “World Imagery Way Back”, which allows performing time series analysis providing historical data, will be useful for future projects. All in all, Living Atlas is a platform with countless capabilities, from simply visualizing the Earth’s surface to performing powerful analysis and I believe it is definitely a platform worth exploring.

Geospatial applications for food, water and energy nexus in the drylands of Africa
Francis Oloo
This session focused on different modern geospatial technologies that are currently being used in the drylands of Africa to tackle food and water shortages and study the energy nexus. New technologies allow for real-time modeling using real-time sensor data that track agents interacting in space every second of the day (in contrary to older sensor technologies that delivered data a few times a year). This tracking reveals a lot about the agent’s behaviors and their environment. Apart from ground sensors, Big Earth Observation (EO) data can also reveal the impacts of anthropogenic activities on the environment, particularly in Africa, which faces many problems regarding food and water. A study using both EO and sensor data aimed at understanding the effect of land use change for producing food and whether the land is becoming more fertile. Interestingly, the study revealed that it is a better practice to use the already existing agricultural land and improve the farming techniques that are being used than destroying a forest to create more farmland. Something that I particularly liked in this talk was that the speaker's approach was to break down the “problem” into individual steps/“sub-problems” and tackle them one by one. This approach was implemented in another study, where first the local populations living in the African drylands were asked about the causes of food shortages. The answers were based on their personal experiences and some of them were “foods”, “drought”, “crop failure” and “conflicts”. These experiences were then used and integrated into quantitative spatial methods. A challenge was to decide which kind of data can be used to transfer the implicit knowledge of the citizens into the analysis. What I found really useful regarding this study, was that the analysis was used in order to implement new policies in local communities that will help with food shortages. Lastly, I believe a “take away” knowledge that I gained form this session, was to not trust satellite imagery one hundred percent and try to find ground truth data as well or ask the local communities. This derived from the example of monitoring the drylands with EO data and although a lot of the areas appeared green, meaning that a lot of vegetation is present, data from the ground revealed that these plants did not produce any food, so the assumption that the presence of vegetation automatically means that food is available was wrong.

4D Campus Map: Datenintegration und Verlinkung für die Visualisierung in interaktiven Webkarten und VR Umgebungen - Ergebnisse und Einblicke in die Forschungsprojekte 5G EXPS und 5G MOBiS
Caroline Atzl, Michael Andorfer and Florian Schöpflin
This session focused on the presentation of a 5D model that was created for the Itzling campus. The goal of this use case is to capture and analyze the current state of the Science city Itzling campus using human sensors and drone data. A lot of insights about the project were presented, such as the method of data collection using drones, which involved a lot of challenges because of the large size of the data, the creation of 3D buildings from these data, the integration of 360o images from the inside of the buildings, the 4D campus map and the gamified campus of the map created in ArcGIS. Some of the aspects of this presentation that I found really interesting were first the level of detail of the data that were captured from the UAV which make the 3D buildings look like they are almost real. Also I gained a lot of insights regarding the creation of the 3D buildings in ArcGIS Pro, since I have not really worked with 3D data before. I found particularly smart the idea of creating domains for, for example, the kinds of openings that a building has, which direction can the door be opened, different materials etc. Also I found that the integration of videos and websites in 360o view “inside” the rooms of Techno-Z makes the tool more interactive and user-friendly. Additionally I found really useful the integration of live data from sensors inside the rooms like the temperature or if there is an open window, which could even help with managing the building’s energy consumption. Lastly I found the idea of presenting the campus as a game really unique and it was something I saw being implemented in a GIS software for the first time and I believe that although there are some challenges, it will definitely be a useful tool for the future. A next step that I believe would be useful, especially for the students, would be to add where the office of each professor is “outside” their office door. All in all, I believe that having a 5D map of the campus will be very beneficial both for people that already use the buildings and for visitors since the Techno-Z buildings are not so easy to navigate into.
Eye-tracking in cognitive cartography
Stanislav Popelka
This session focused on eye-tracking techniques that can be utilized to evaluate maps based on how users respond to them. More specifically it can be used to assess not only the effectiveness and efficiency of a map but also the user’s satisfaction. Personally, I found the session really insightful since it was a concept I had never heard about before and especially it’s applications on map quality. I believe it is an interesting tool to evaluate how people perceive maps, what is clear and understandable to them and what might be unclear or confusing. I found the fact that people focus on different things on a map depending on their background particularly interesting. Lastly, it is a useful tool for the evaluation and improvement of online interactive maps, which are harder to make “user-friendly” than more traditional maps. Although this method is rather expensive and cannot be performed for every single map that is being produced, I think that it must be used for evaluating more critical maps like “road maps” or maps depicting hiking paths. Also, the results of such studies as the ones presented in this session can be useful for improving our own maps, even without having the specific tools in our hands.
Time Series and Multi-temporal Classification in Forest Studies
Premysl Stych
This session focused on how we can assess the health of forests that are affected from different insects and the calamities than forests face due to climate change using time series analysis. One of the first remarks of this session was that our ability to identify changes over time has changed, mainly because of technological improvements such as the availability of long-term satellite data sets, increased computing power and cloud computing, and improved processing methods. In forest studies many different topics can be analyzed and mapped such as damages form insects, fire recovery, vegetation development, wind calamities and more. This can be done for example using multitemporal Sentinel-2 satellite data and comparing different vegetation indices (e.g the NDVI) or applying different classification techniques, such as the Support Vector Machine. An important reminder was to choose the most suitable index depending on the conditions of the area of interest. Indices can also be compared with different classification methods to determine the best approach for each application. It was insightful to see how many different techniques can be used in a specific field such as forest studies. It was also emphasized that the availability of open Earth Observation data and open-source software are a big advantage and together with cloud based platforms for computing, they have changed the way a lot of analysis is being performed. Lastly I found interesting that the use of EO Browser in Sentinel Hub was shown, through which different pre-calculated indices can be visualized and there is also the possibility for each user to calculate their own.
